Working with the Tools Diagram
The Tools Diagram provides a visual representation of the data flow in a sensor system (the output from a sensor, and the input and output of tools). It lets you create and view complex tool chains with drag-and-drop and other mouse operations, letting you implement and maintain applications demanding multiple, interconnected tools, quickly and easily.
All data types and their relationships between tools are displayed:
-
Profile data (either directly from a sensor’s output or from tool output)
-
Surface data (either directly from a sensor’s output or from tool output)
-
Measurements (for use as anchors)
-
Geometric features
-
Tool data output (some data outputs are intended to be consumed only by SDK applications and can’t be used as part of a tool chain withing Gocator)
For details on how the Tools Diagram panel displays information, see Understanding the Data Flow in Tool Chains.
For details on how to connect and disconnect, see Connecting Tools and Disconnecting Tools.
The Tools Diagram panel is open by default. When the panel is open, the parameters of the tool selected in the panel are to the right of the Tools Diagram panel. You can close the Tools Diagram panel by clicking the  button at the top of the panel. When you close it, the tool drop-down list and button used to add tools moves to the Tools Configuration panel.
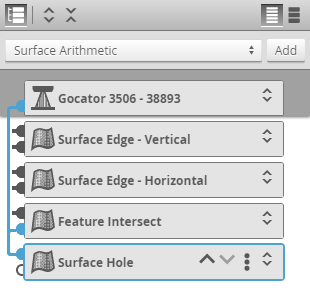
The following illustrates the main aspects of the Tools Diagram panel.
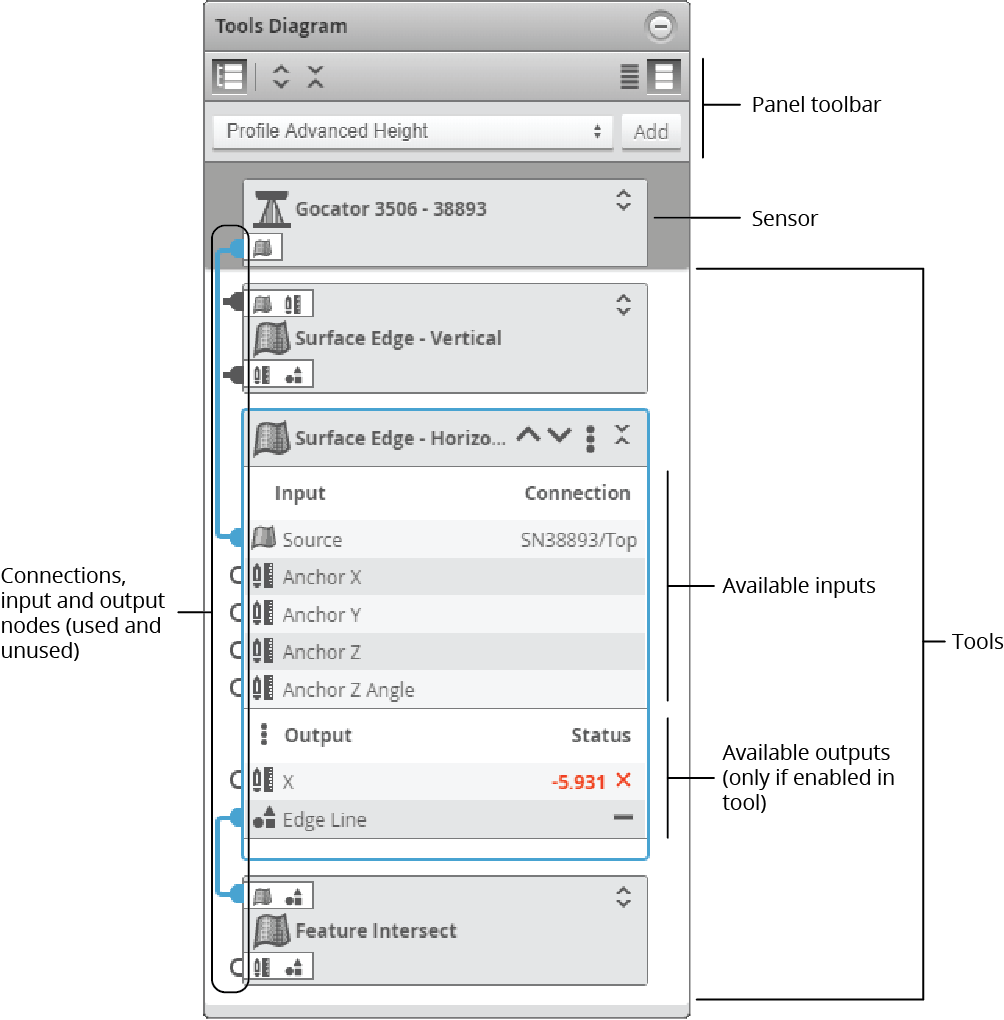
Tools Diagram panel showing sensor, tools, outputs/inputs, and data flow connections.
At the top of a tool, a drop-down menu provides functions to rename, duplicate, and delete the current tool. For more information, see the topics below.
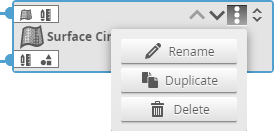
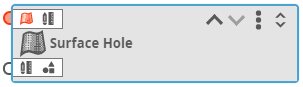
Action menu (collapsed tool)
Adding a Tool
In the Tools Diagram panel, you add a tool using the drop-down and the Add button below the panel’s toolbar.
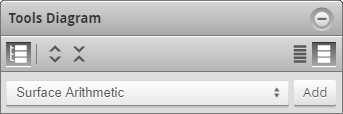
To add a tool in the Tools Diagram panel
| 1. | In the drop-down at the top of the panel, choose a tool to add. |
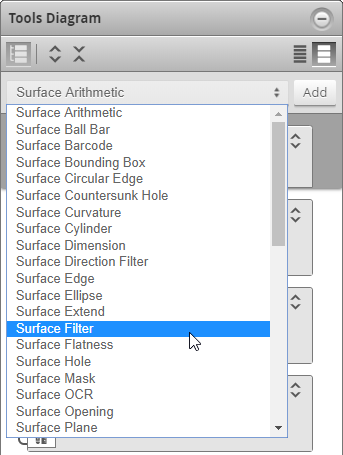
| 2. | Click Add. |
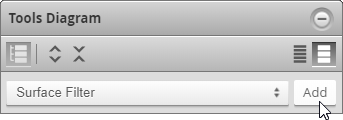
The tool appears at the bottom of the Tools Diagram panel.
After you have added a tool, you must configure it. For information on configuring tools, see .
Deleting a Tool
In the Tools Diagram panel, you delete a tool using the Action menu of an individual tool.
To delete a tool in the Tools Diagram panel
| 1. | Click the Action menu icon. |
A context menu appears.
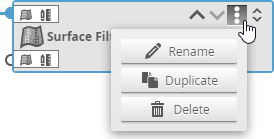
| 2. | In the context menu, choose Delete. |
The tool is removed from the Tools Diagram panel.
Renaming a Tool
In the Tools Diagram panel, you rename a tool using the Action menu of an indivual tool.
To rename a tool in the Tools Diagram panel
| 1. | Click the Action menu icon. |
A context menu appears.
| 2. | In the context menu, choose Rename. |
| 3. | In the tool name field, rename to the tool. |
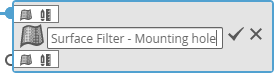
| 4. | Press Enter on the keyboard or click the check icon (see above). |
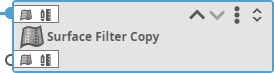
Duplicating a Tool
In the Tools Diagram panel, you duplicate a tool using the Action menu of an individual tool.
To duplicate a tool in the Tools Diagram panel
| 1. | Click the Action menu icon. |
| 2. | A context menu appears. |
| 3. | In the context menu, choose Duplicate. |
A copy of the tool appears below the tool you copied, with “Copy” appended to its name.
Displaying and Ordering Tools
The buttons at the top of the Tools Diagram panel let you control how the panel displays sensors, tools, and the data flow (tool chain). Buttons at the top of individual tools let you organize the tools in the list, as well as name, duplicate, and delete them.
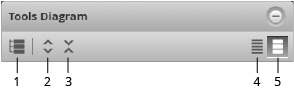
The following describes the toolbar's functions:
-
Show/Hide Connections: Toggles displaying lines showing the data flow related to the selected item (the sensor or a tool). The connection lines let you see at a glance how the tools are chained together. You can highlight subsections of connections to better understand the data flow. For more information see Understanding the Data Flow in Tool Chains. For more information on connecting and disconnecting tools, see Connecting Tools and Disconnecting Tools.
-
Open All: Expands all the sensor and tools in the Tools Diagram panel, displaying a list of available inputs and enabled outputs for each one.
-
Close All: Collapses all items in the Tools Diagram panel.
-
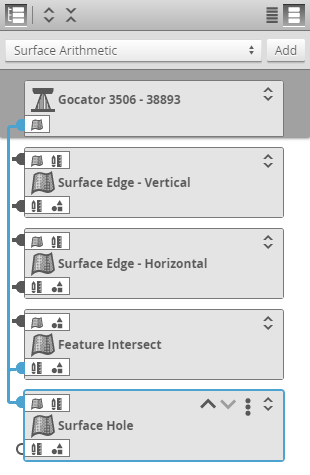
Compact View: Hides the list of small input and output icons that indicate the types of the inputs and outputs the sensor or a tool has.
-
Standard View: Shows small icons that indicate the types of the inputs and outputs the sensor or a tool has. The icons are only shown on collapsed sensors or tools. For a list of inputs and outputs, see Data Types.
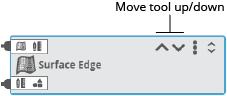
Use the up / down buttons next to the Action menu on individual tools to move the tool up or down in the panel. Note that the order of tools in the Tools Diagram panel does not affect the data flow. However, you can order tools to make the data flow clearer.
Data Types
Gocator represents data types in the Tools Diagram panel by an icon. Larger icons indicate the type of a tool (for example, a Profile tool vs. a Surface tool). Smaller icons are used to indicate the types of a tool’s inputs and outputs when the Tools Diagram panel is set to Standard view (the small icons are hidden in Compact view); for more information on views, see Displaying and Ordering Tools.
|
Icon |
Description |
|
|
Surface data. |
|
|
Profile data. |
|
|
Range data. |
|
|
Measurement. |
|
|
Geometric feature. |
|
|
Tool data output. |


Understanding the Data Flow in Tool Chains
The rectangular elements displayed in the Tools Diagram panel represent a sensor at the top (dark grey area) and any tools you have added below that. Sensors display output connection nodes, whereas tools display both input and output connection nodes.
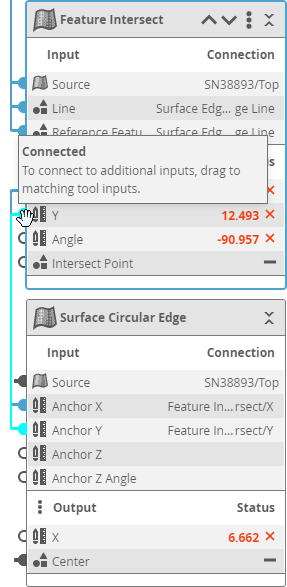
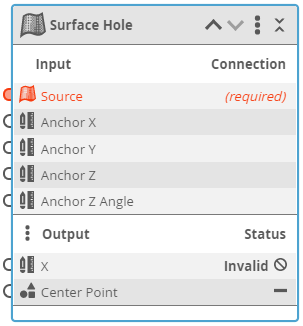
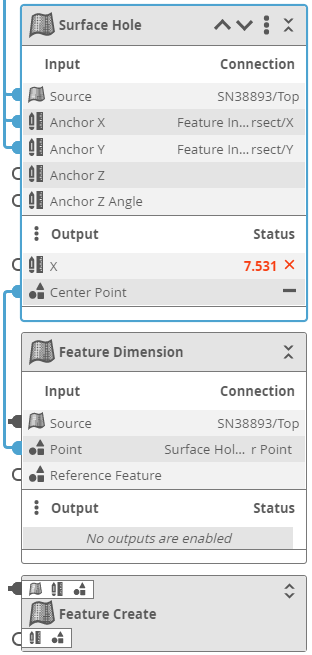
The appearance of nodes changes depending on whether they are connected and whether they are selected. Connections that are used are filled. Connections that are not used are empty. When a sensor or tool is expanded, you can see which specific inputs or outputs are used and part of the tool chain. For example, in the expanded Surface Circular Edge tool below, we can see that the first three inputs (Source and two anchors, receiving their input from the sensor at the top and from Feature Intersect, respectively) and the Center output are involved in the chain of sensor and tools.
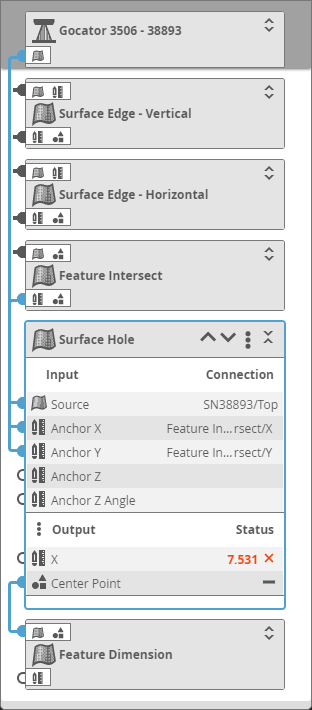
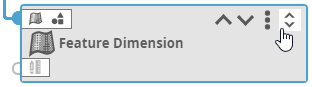
When a tool is collapsed, however, you only know that at least one input or output is used (or none at all). For example, looking at the collapsed Feature Dimension tool at the bottom, we know that at least one input (the connection node at the top) is used, and that none of the tool’s outputs are used. Also, we know that inputs and outputs of the three collapsed tools at the top are used, but not exactly which ones.
In both cases (collapsed or note), the data flow of the selected item is indicated by dark blue connection lines. For more information, see below.
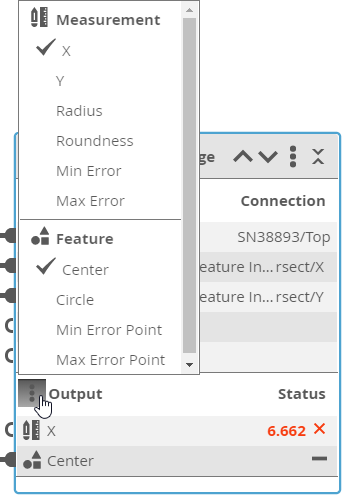
By default, sensors and tools are collapsed, but you can expand them individually by clicking the expand / collapse button at the top right of a tool to display the complete list of available inputs and outputs. Note that for an output to be listed in the Outputs section, it must be enabled in the tool’s configuration: in the tool’s Output list, only enabled outputs are listed.
To see a complete list of a tool’s outputs (as opposed to only the enabled ones), at the top of the tool's Output section, click the Output menu button ( ). A pop-up list of all available outputs displays, indicating the enabled outputs with a checkmark.
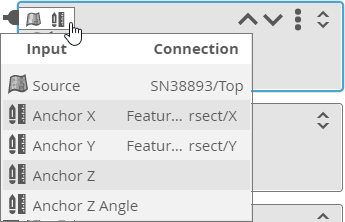
When a tool is collapsed, you can “peek” the available inputs or the enabled outputs by clicking one of the horizontal lists of small icons (Standard view only).
If you hover the mouse pointer over a blue connected node, a part of the blue connection line is highlighted to indicate what it is connected to. In the image below, you can see that by hovering over an output (the Y measurement of the Feature Intersect tool at the top) is used as an input (the Y anchor) of the Surface Circular Edge at the bottom.

|
Script tools take no input in the Tools Diagram panel, as all outputs are available to these tools via their script functions. |
If you remove a tool whose output is used by another tool as input, that input is displayed in red in the Tools Diagram panel to show that you must reconnect them.
Collapsed tool with a missing input
Expanded tool with a missing input
For information on connecting outputs to inputs, see Connecting Tools.
Connecting Tools
The Tools Diagram panel lets you quickly connect tools using drag-and-drop operations.
|
|
Displaying the connections (using the Display Connections button at the top of the panel) while connecting tools may be helpful. |
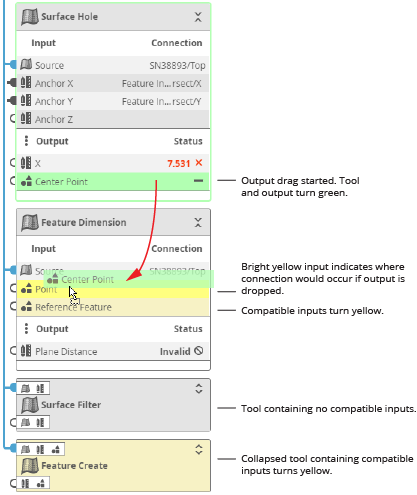
In the following, we connect a geometric feature output from one tool to the input of another tool. However, the same procedure applies when connecting other kinds of outputs to inputs, such as connecting a measurement from one tool to one of the anchors available in another tool, or when connecting Surface output (such as the output from the Surface Filter tool) to the Source input of another tool (which is initially set to the direct output of a sensor).
To connect a tool’s output to another tool’s input:
| 1. | Make sure you have added at least two tools and that you have configured the tools higher in the tool chain. |
The output you want to connect must be enabled in the first tool.
For information on adding tools, see Understanding the Data Flow in Tool Chains.
| 2. | Locate the tool whose output you want to use (the “source” tool). |
| 3. | Do one of the following: |
With an expanded tool
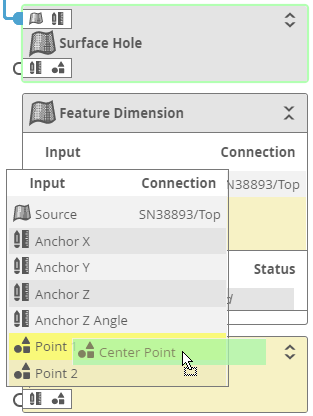
| a. | Click and hold the output you want to connect to the other tool’s input and drag it to the input. |
With a collapsed tool
| a. | Click the small output types at the bottom of the tool to expand the list of |
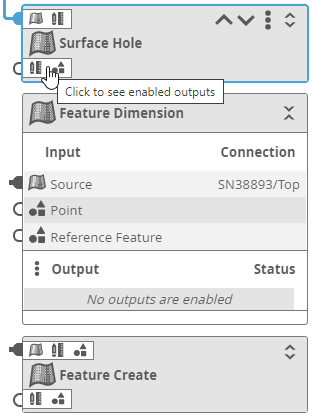
A list of enabled outputs is displayed in a pop-up list.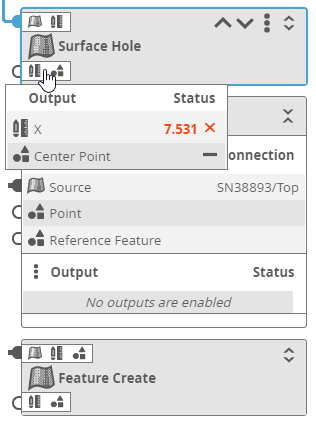
| b. | In the pop-up list, click and hold the output you want to connect to the other tool’s input and drag it to the input. |
The source tool’s border and the dragged output turn green. Compatible inputs turn yellow. The input to which the output will be linked if you drop it is highlighted in bright yellow; in the image above, this is the Point input.
Collapsed tools containing compatible inputs also turn yellow. If you move an output over a collapsed tool, a popup showing the tool’s available inputs is displayed.
| 4. | Drop the output on the desired input. |
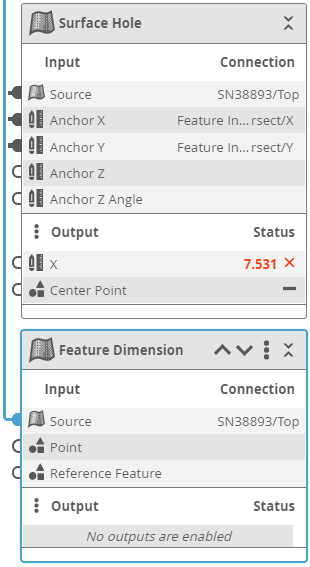
A new connection appears between the first tool’s output and the second tool’s input (below, between the Surface Hole tool’s Center Point output and the Point input in the Feature Dimension tool).
|
|
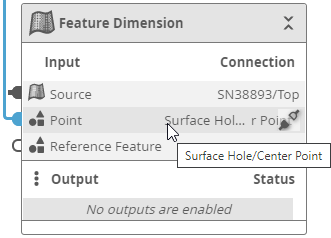
You can see the full name of an input or an output in a tooltip if you hover the mouse pointer over it. |
Disconnecting Tools
You can quickly disconnect an input in the Tools Diagram panel, but only if the tool containing the input is expanded.
To disconnect an input in a tool:
| 1. | If the tool isn’t expanded, click the Expand button at the top of the tool. |
| 2. | In the expanded tool, move the mouse pointer over the input you want to disconnect and move it to the right until the pointer is over the Disconnect icon. |
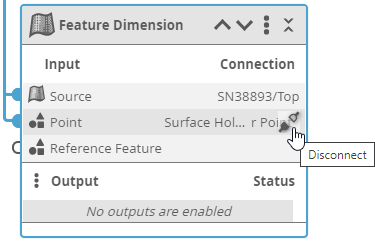
| 3. | Click the Disconnect icon. |
The input is disconnected from the other tool’s output. (Below, the connection between Center Point and Point is remoeved.)