Pinning Measurements and Features
You can “pin” one or more tool outputs (measurements and geometric features) to a data viewer. When these outputs are pinned, they remain visible in a data viewer at all times, even when you click on a different tool, measurement, or feature in one of the lists the web interface displays. When no tool outputs are pinned, only the currently selected tool output is displayed in the data viewer. Pin information is stored in job files, so particular monitoring or configuration setups are automatically retrieved when you load a job containing pinned outputs.
Pinning outputs is useful if you want to monitor multiple, independent measurements while the Gocator is running in production. Pinning is also useful when setting up tools: you can change the parameters of a tool (such as a filter) earlier in a tool chain and immediately see the impact that modification has on another tool later in the chain. This minimizes toggling and clicking between tools and measurements. Pins are automatically stored as measurements in job files.
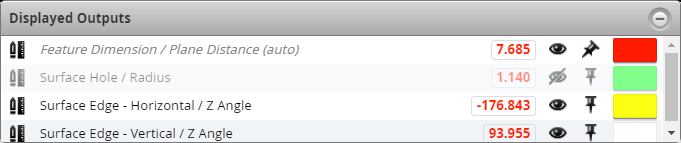
In the following image, a Feature Dimension Plane Distance measurement (measuring the distance between the corner of a CPU and a mounting hole) is currently selected. Three other measurement (Surface Edge Z Angle measurements on two sides of the CPU and a Surface Hole Radius measurement to the lower right) are pinned.
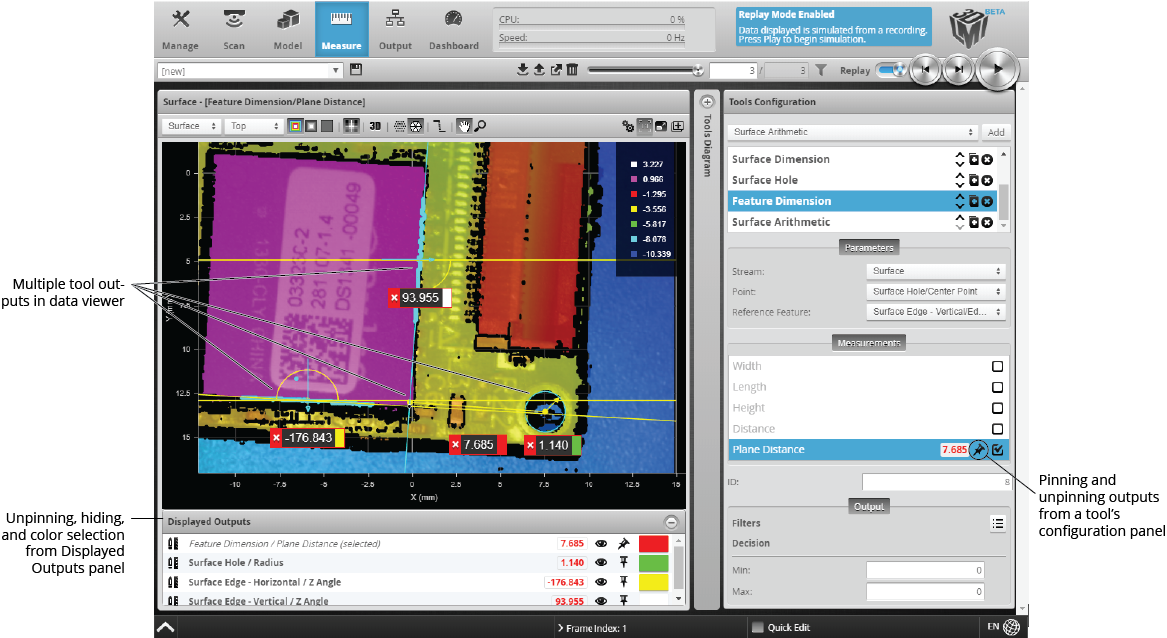
Data viewer showing the currently selected measurement and three pinned measurements.
You pin and unpin tool outputs from a tool’s configuration panel (in the list to the right of the data viewer). You can also pin and unpin outputs on the Dashboard page (the procedure is very similar); however, pinned outputs in the Dashboard are not independent from those in the main data viewer. You can pin outputs independently when you have multiple data viewer windows open (for more information, see Using Multiple Data Viewer Windows).
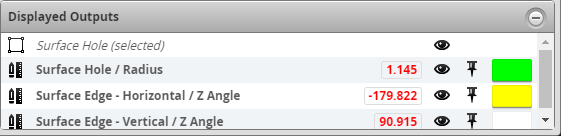
You can unpin and hide outputs in the Displayed Outputs panel below the data viewer, and pin the currently selected output. You can also choose the color of the measurement value. The currently selected but unpinned output is indicated by “(selected)” in the panel's list, meaning it is automatically but temporarily added: it will be removed from the panel's list when you switch to another output.
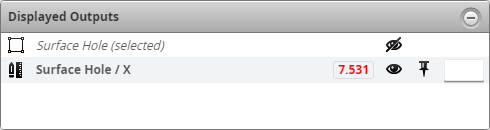
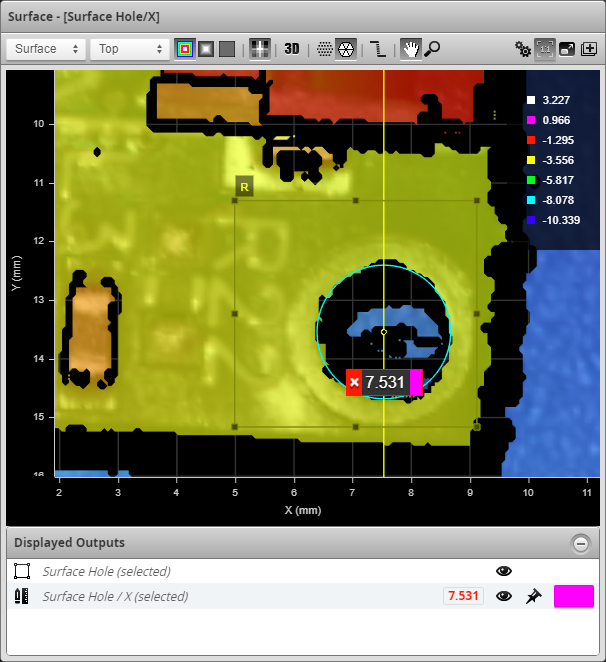
Tools (distinct from their outputs) with definable regions of interest can also appear in the list: this lets you temporarily hide the regions to reduce the visual elements in the data viewer. For example, in the following, the region definable in the Surface Hole tool is hidden, independently of the Surface Hole X measurement:
The naming convention for outputs in the Displayed Outputs panel is as follows:
Tool_icon Tool_name / Measurement_name
To pin or unpin a tool output from a tool’s configuration panel:
| 1. | Go to the Measure page. |
| 2. | In a previously added and configured tool, go to the Measurements or Features tab. |
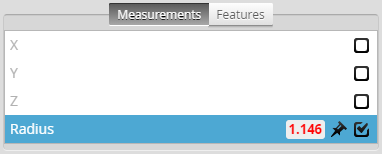
| 3. | In the tab, locate the output you want to pin or unpin and do one of the following: |
Pin an output:
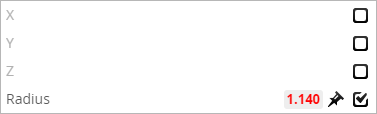
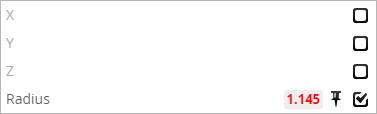
| a. | If only the Main View data viewer is open, click the pin icon next to the output you want to pin. |
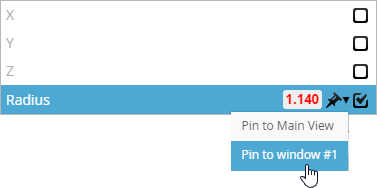
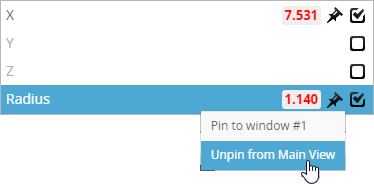
| b. | If you have opened additional data viewer windows, click the pin icon and choose the view to pin the output to from the drop-down. |
The output is added to the list in the Displayed Outputs panel in the data viewer you chose and is pinned in that data viewer.
For more information on using multiple data viewer windows, see Using Multiple Data Viewer Windows.)
Unpin an output:
| a. | If only the Main View data viewer is open, click the pin icon next to the output you want to unpin. |
If you have opened other data viewer windows, you choose which one from which to unpin the output. (For more information on using data viewer windows, see Using Multiple Data Viewer Windows.)
The output is removed from the Displayed Outputs panel and is no longer displayed in the data viewer, unless it is currently selected in a tool’s list of outputs.
In the Displayed Outputs panel below a data viewer, you can also manage the pinned outputs of that data viewer, unpinning and hiding outputs, and choosing a measurement value’s color.
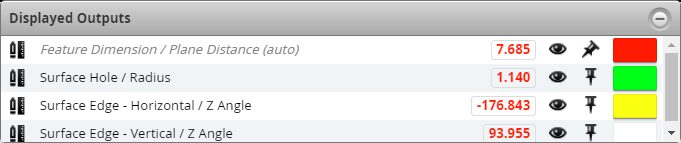
To unpin an output in the Displayed Outputs panel:
-
In the Displayed Outputs panel, click the pin next to the output you want to remove.
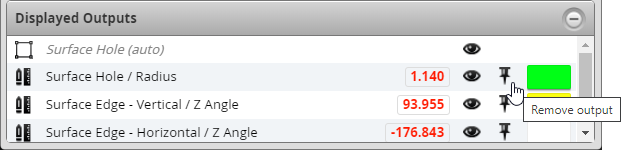
The output is removed from the list in the panel, and is no longer displayed in the data viewer, unless it is currently selected in a tool’s configuration.
You can temporarily hide an output in a data viewer to make it easier to work with the data viewer. The state of outputs (shown vs. hidden) is not stored in the job file.
To hide or show an output in the Displayed Outputs panel:
| 1. | In the Displayed Outputs panel, do one of the following: |
Hide an output:
| a. | Click the eye icon ( |
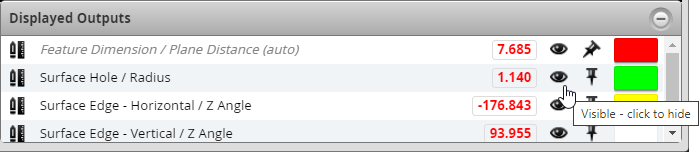
The output in the panel is greyed out and it is no longer displayed in the data viewer. The output is still pinned to the data viewer.
Show a hidden output:
| a. | Click the barred eye icon ( |
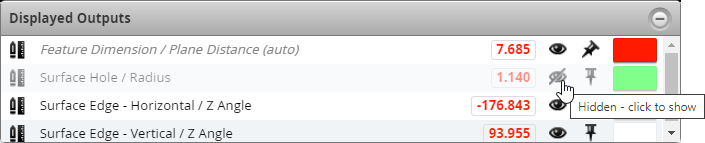
The output returns to the visible state.
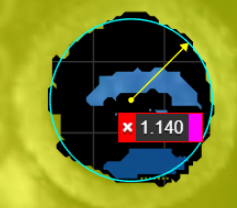
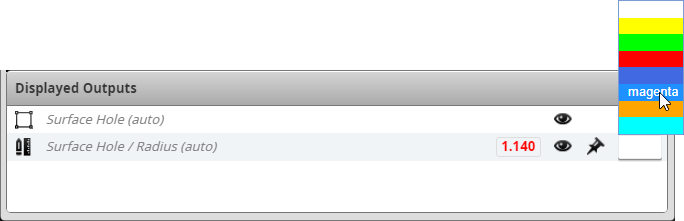
You can choose the color of the right vertical part of a measurement value that’s displayed in a data viewer. In the following image, the color associated with the Surface Hole X measurement value has been set to magenta:
To change a measurement value’s associated color:
| 1. | In the Displayed Outputs panel, click one of the rectangles of color. |
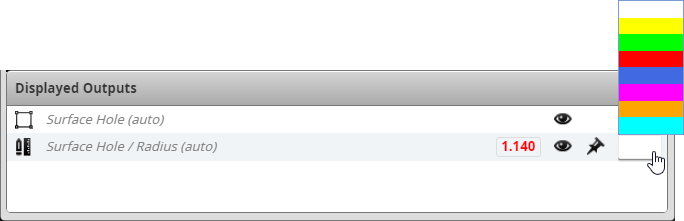
| 2. | In the color picker, choose a color. |
The color associated with a measurement value is changed.