Section
The Surface Section tool lets you define a line on a surface (a "section") from which the tool extracts a profile. You can apply any Profile tool to the resulting profile (see Profile Measurement). Note that a section can have any XY orientation on the surface, but its profile is parallel to the Z axis.
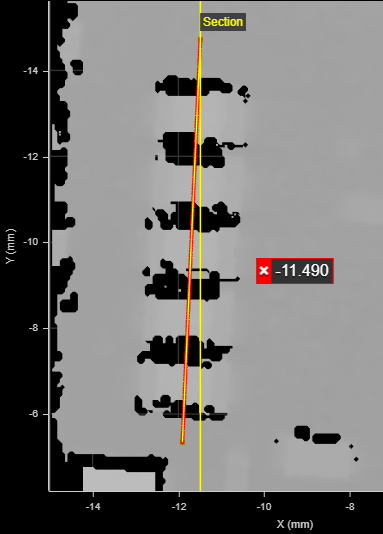
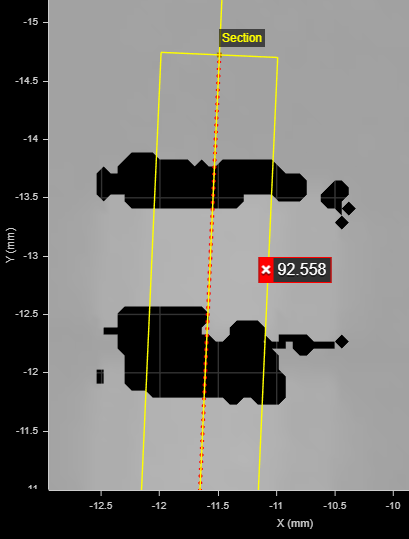
A section over a row of components
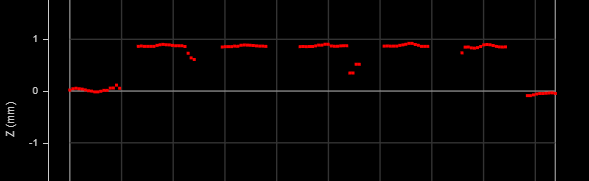
The resulting profile
Note that profiles extracted from surfaces start at the point defined as the X/Y Start of the section. Profiles are always displayed horizontally, with X increasing to the right. The origin of extracted profiles is the beginning of the section, and not relative to the surface from which they are extracted.
The Surface Section tool provides functionality similar to sections you can define on the Models page (see Models). However, the Surface Section tool has a few advantages.
One advantage of the Surface Section tool is that you can anchor the tool to some other easily identifiable feature on the scan target, which "shifts" the section in relation to that feature: this increases repeatability.
Another advantage is that unlike sectioning generated from the Model page, the Surface Section can take any surface as input, such as a combined surface (using Surface Extend or Stitch), a transformed surface (using Surface Transformation), a filtered / corrected (Surface Filter and Surface Vibration Correction), and so on.
Finally, the Surface Section tool provides measurements useful for calculating the global X/Y coordinates of the resulting profile, using a Script tool See Script. Even if you don't use anchors or the measurements, LMI recommends using the Surface Section tool over model-based sections.
|
2D View |
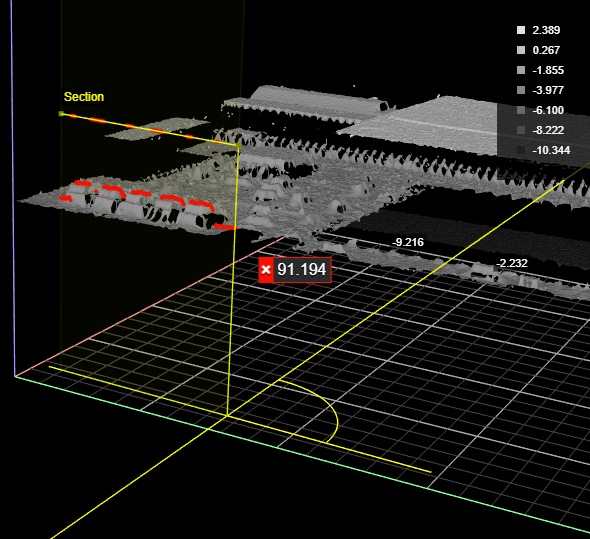
3D View |
Measurement Panel
For information on adding, managing, and removing tools and measurements, as well as detailed descriptions of settings common to most tools, see Tools Panel.
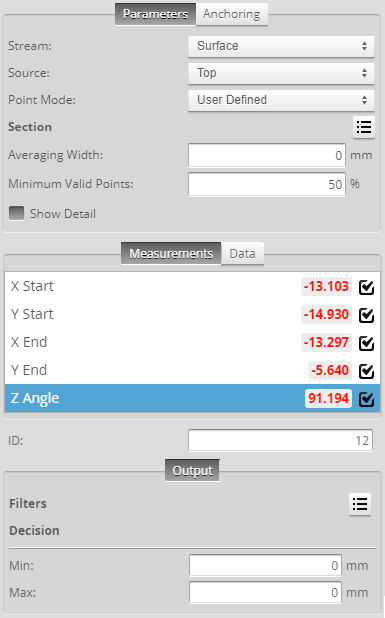
Measurements, Data, and Settings
| Measurement |
|---|
|
X Start These measurements return the X and Y position of the start of the section, respectively. |
|
X End These measurements return the X and Y position of the end of the section, respectively. |
|
Z Angle Returns the rotation of the section around the Z axis. |
| Type | Description |
|---|---|
|
Uniform Profile Raw Profile |
The profile the tool extracts from the surface. Available to profile tools for profile measurement. |
| Parameter | Description |
|---|---|
|
Source |
The sensor |
|
Point Mode |
Determines the way the tool sets the end points of the section. One of the following:
|
|
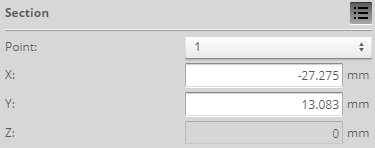
Section |
Contains the coordinates of the two points that define the ends of the section. Only displayed if Point Mode is set to User Defined (see above).
Point The point to configure (1 or 2). X, Y, Z The coordinates of the point selected in Point. Note that you can't edit Z. |
|
Point 1 Point 2 |
Sets the Point geometric features the tool uses as the section's end points. Only displayed if Point Mode is set to Feature Points (see above). |
|
Averaging Width |
The width, in millimeters, of a window in which averaging of data points perpendicular to the section occurs. Use this to compensate for noise around the section. In the following, Averaging Width is set to 1. The red dots, representing the data points of the extracted profile, are the result of averaging the neighboring points along a line perpendicular to the section. When non-zero, this setting works in conjunction with the Minimum Valid Points setting (see below).
When set to 0, only data points directly under that section are used in the profile.
|
|
Minimum Valid Points |
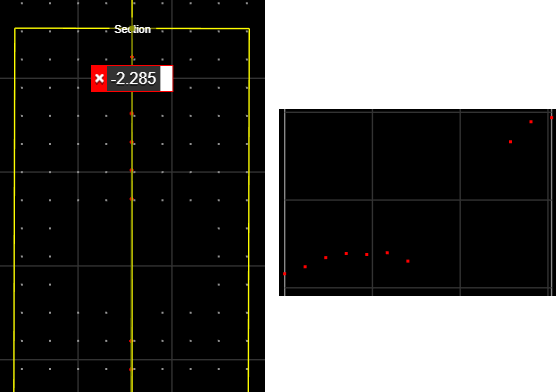
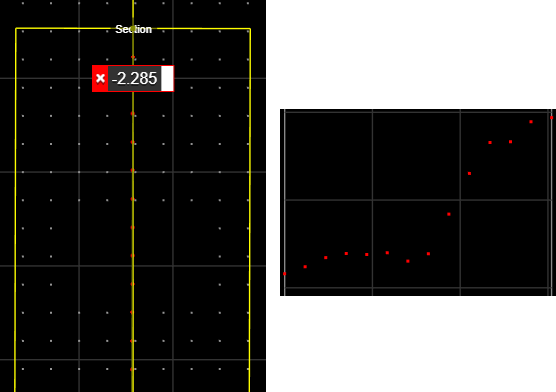
When Averaging Width is non-zero, the minimum percentage of neighboring points across the averaging width (perpendicular to the section) that need to be valid for a point to be output on the resulting profile. With the following Surface scan data (zoomed in and with the data viewer set to show individual data points), Minimum Valid Points has been set to 100%. As a result, no data points are output to the profile in the area that lacks valid data points (see profile to the right).
But with the following scan data, Minimum Valid Points has been set much lower, to 10%. As a result, the three or four data points to each side of the void are enough for an average to be calculated, and points are included in that area in the profile.
|
|
Show Detail |
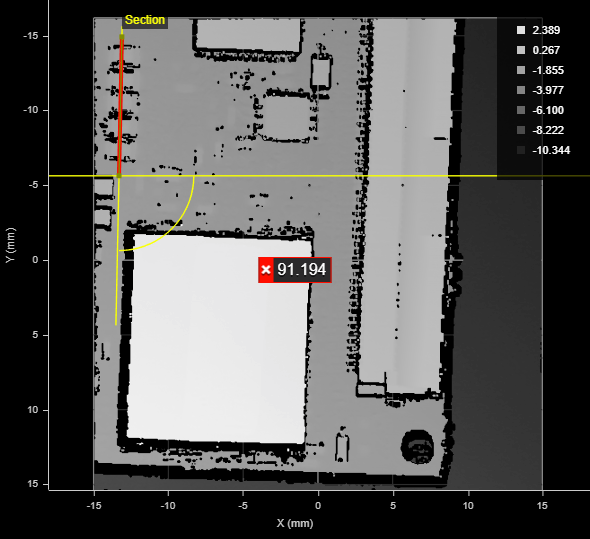
Determines whether data points (in red) are displayed under the section in the data viewer. If this setting is disabled (as shown below), only the yellow line representing the defined section is displayed.
|
|
Filters |
The filters that are applied to measurement values before they are output. For more information, see Filters. |
|
Decision |
The Max and Min settings define the range that determines whether the measurement tool sends a pass or fail decision to the output. For more information, see Decisions. |


| Anchor | Description |
|---|---|
|
X |
Lets you choose the X |
|
Z angle |
Lets you choose the Z Angle measurement of another tool to use as an angle anchor for this tool. |

|
A measurement must be enabled in the other tool for it to be available as an anchor. The anchor measurement should also be properly configured before using it as an anchor. |
|
|
For more information on anchoring, see Measurement Anchoring. |